Something is not quite with the batteries, but it might not be the batteries! But then again, it could be the batteries.
And so the investigation starts, why do we seem to have trouble charging the batteries off our Solar panels, even when we have a full day of sun? It starts with understanding how much electricity we use, how much we generate and will likely end with a battery monitoring system and maybe even new lithium batteries.
This blog-post is a work in progress, and we are still working out the details.
Step 1 – Understand our Electricity Usage
There are many things in Molly that use electricity, but most of them are off most of the time. There are some things that are on all the time and here are their energy consumption
- The Cradlepoint Modem. At idle is 4 watts and goes to 9 watts with WiFi. Let’s call it 9 watts.
- The Mintbox computer is 5 to 15 watts depending on connected devices. Let’s call it 10 watts.
- The Raspberry pi is around 10 watts with all USB ports in use.
- Each solar charger uses between 1.7 and 3 watts depending on what they are doing. We have 2.
- The TPMS monitoring gateway uses around 2 watts.
- The house fridge is rated at an instantaneous consumption of 72 watts, but average consumption is 440 watts per 24 hours, at 25ºC. Or only 20 watts per hour.
- The second fridge is rated at an average of around 154 watts per 24 house, at 25ºC. So this is around 6 or 7 watts per hour.
- Lastly although the inverter is off, it has a little parasitic drain. This is called “searching” mode and consumes less than 8 watts (see notes later).
So, doing a little math, and excluding the fridges for a moment, the total background draw is around 44 watts which at 12.5 volts is around 3.4 Amps. This is very close to what we measure, which is around 3.5 Amps. Of course, when we turn on interior lights, make a cup of coffee or basically do anything, this value will go up.
The draw from the fridges is very dependent on the outside temperature and the operating mode of the fridge. But going with the specification from the manufacturers, we can add another 594 watts (every 24 hours) to the 44 watts already from the electrical devices, giving a grand total of close to 1,650 watts.
We have 2 Mastervolt AGM batteries each rated at 270 Amp Hours (Ah). But AGMs should not be discharged below 50% of their total capacity, so instead of 540 Ah, we really only have a combined capacity of 270 Ah. Without running anything, this means we would get around 2 days. In theory.
Step 2 – Initial Measurement (March 2020)
Fortunately we have a BEP Marine DC System Monitor (DCSM) which is wired up to the house batteries and can display the voltage of the house batteries as well as the current consumption (or charging) in Amps. After fiddling with the setup menus, we also configured the monitor to track the State of Charge (SOC), which is calculated using the instantaneous voltage and amps integrated over time, with some compensating factors.
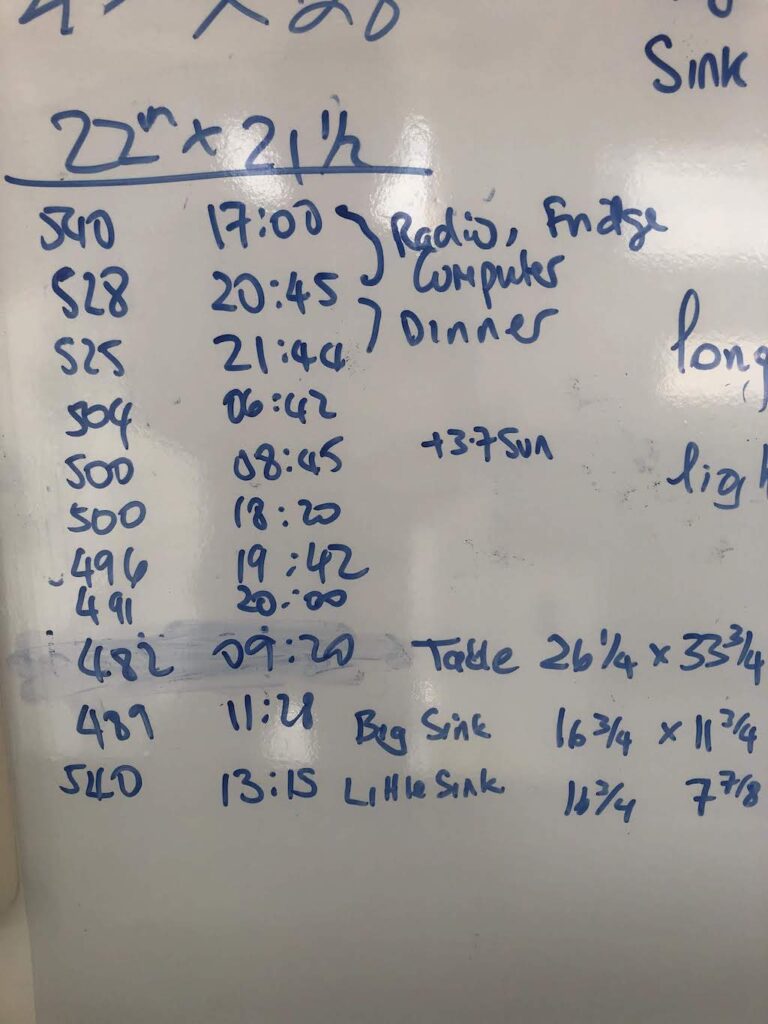
With the house batteries fully charged (at 540 Ah), we monitored how the battery was being drained as follows
- With no Sun and no Alternator charge, and after three hours of driving in the dark, the batteries have dropped from 540 Ah to 528 Ah. During these three hours the fridge went from warm to cold, the radio was playing and our computer and modem were powered up. Not a great way to work out “normal” consumption, so this will be ignored.
- During cooking and dinner, which lasted an hour, another 3 Ah were consumed and the batteries were now down to 525 Ah.
- Waking up early and to catch the battery state before the sun appeared, showed the batteries at 504 Ah, meaning they dropped 21 Ah over a 9 hours. The fridge was on, as was the computer and modem and the iPhone was charging, but everything else was off (technically the inverter was on but nothing was connected). The average energy consumed was 2.5 Amps per hour. Not bad.
- It was a dark day, and I was working on the truck during the day, and let’s just say at the end of the day and the end of the sun the batteries were at 500 Ah.
- One hour and 30 minutes later the batteries were at 496 Ah, which is aligned with the 2.5 Amps per hour. As I headed to bed, 2 hours later, the batteries were at 491 Ah.
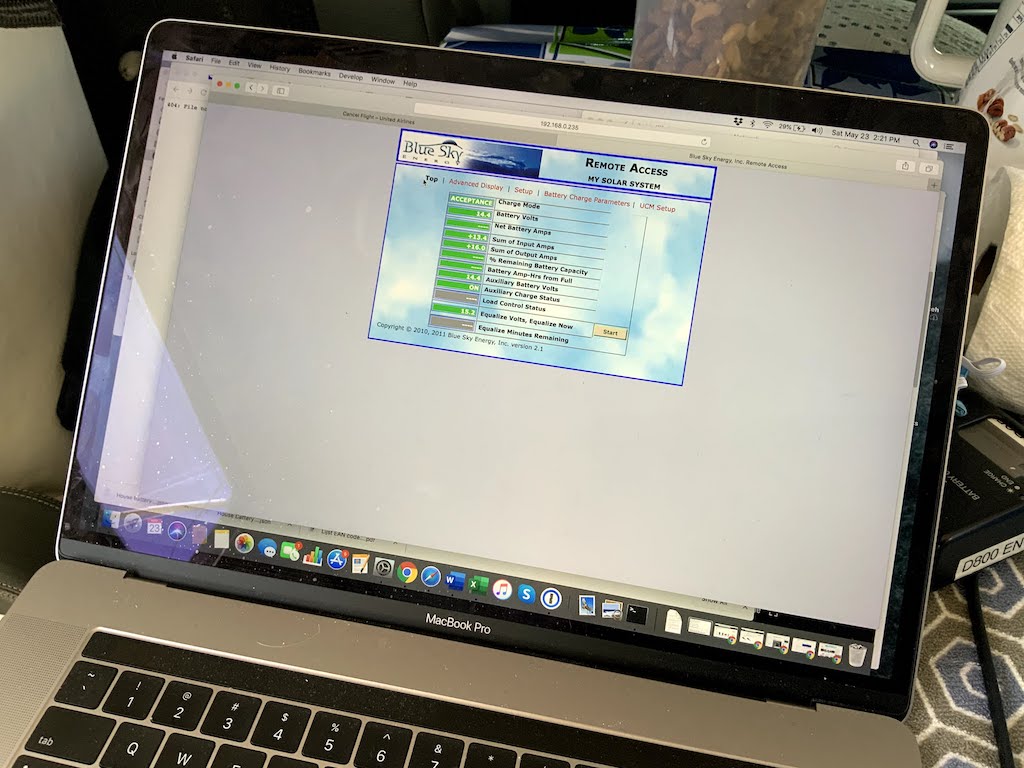
- Getting up late and with the Sun already up, some eleven hours later, the batteries were at 482 Ah, which is good, but guessing this includes about 2 hours of Sun.
- Another 2 hours later, with about 13 Amps coming from the Solar panels, the batteries were at 489 Ah. This is when I started to think that there is a mystery here. The capacity should have been around 499 Ah. This is calculated by taking charge efficiency of 80% of 13 Amps for 2 hours giving 21 Ah. but subtracting background discharge of 2.5 Amps per hour, or 5 Ah gives a total of 499 Ah. So 489 Ah was way too low and probably the cause for the why it is difficult to charge the batteries off solar.
This first, very unscientific experiment, showed that consumption was ok, but charging was not. More equipment would be needed to isolate the problem. The leading theory was that the battery monitor was not correctly configured. Off to amazon to order a DC amp meter and some other goodies.
Step 3 – Adding More Gadgets (May 2020)
The initial measurement indicated that there is something wrong with the setup on the current measurements, but not sure what. Due to the lockdowns surrounding COVID-19, it has not been possible to visit Molly and do further measurements. So, spent the home isolation time working on how to improve measurements. The write-up of these improvements are documented in another post.
Finally got Molly out of storage and had a chance to install all the new goodies. At a high level there are two important new items
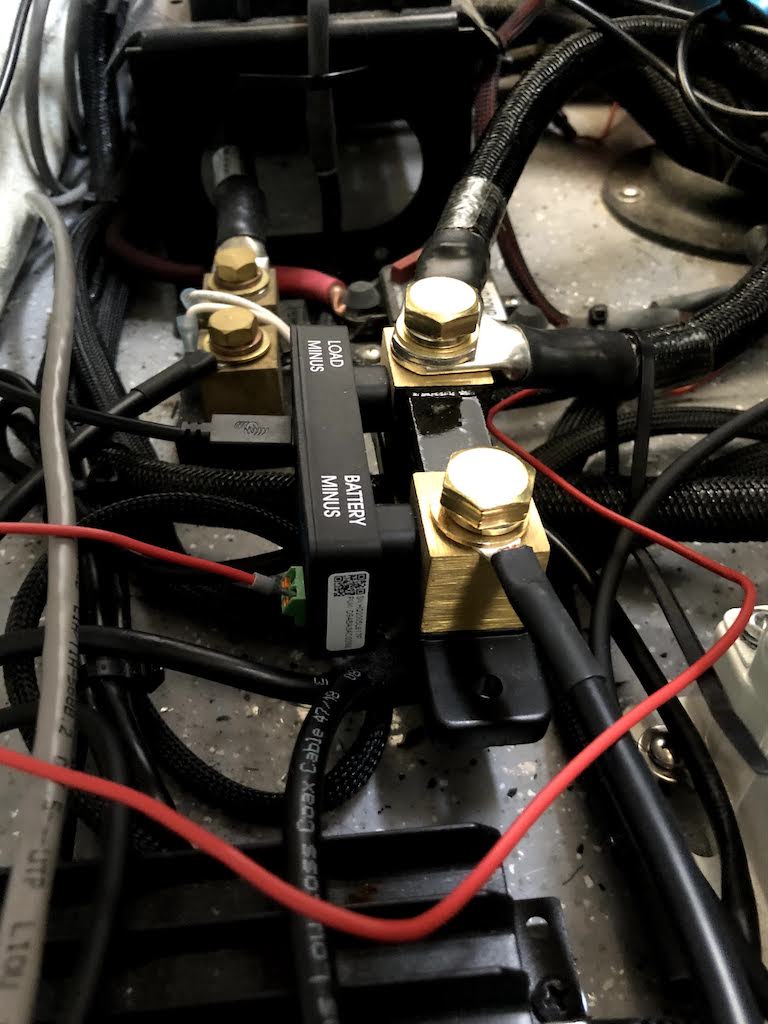
- A current measuring shunt connected to the main or house battery. This device will enable us to measure the amount of energy being removed or added to the battery.
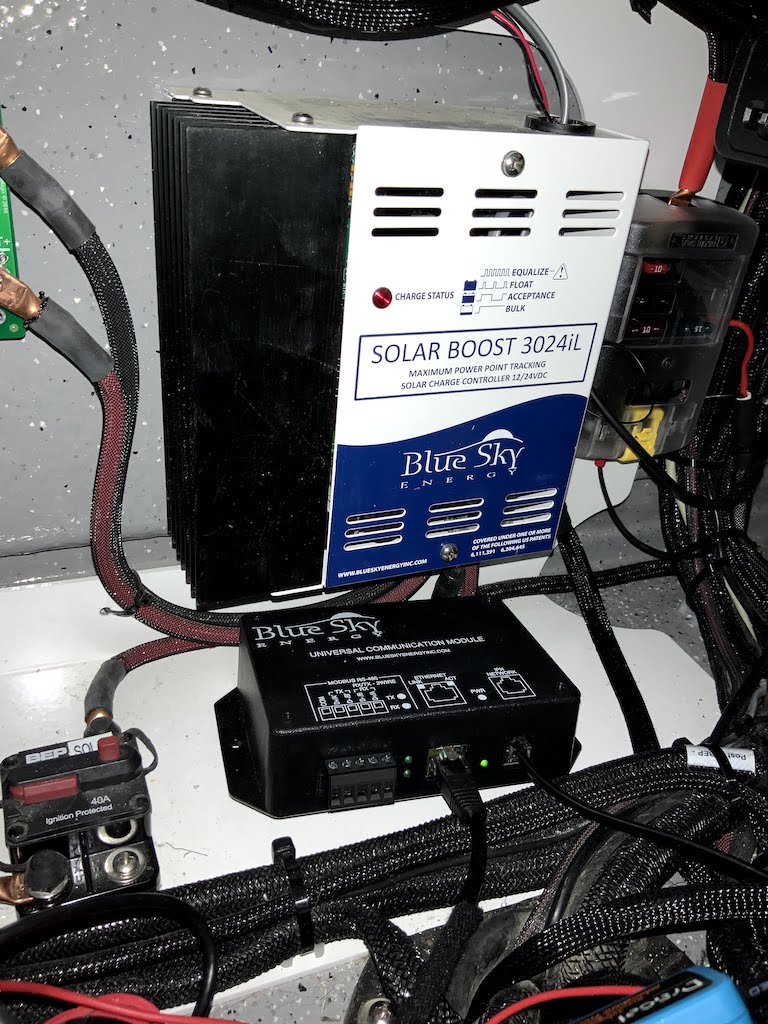
- A gateway device to connect to the solar charger, so we can connect the computer to the solar charger. This device will enable us to measure the amount of energy being produced by the solar panels.
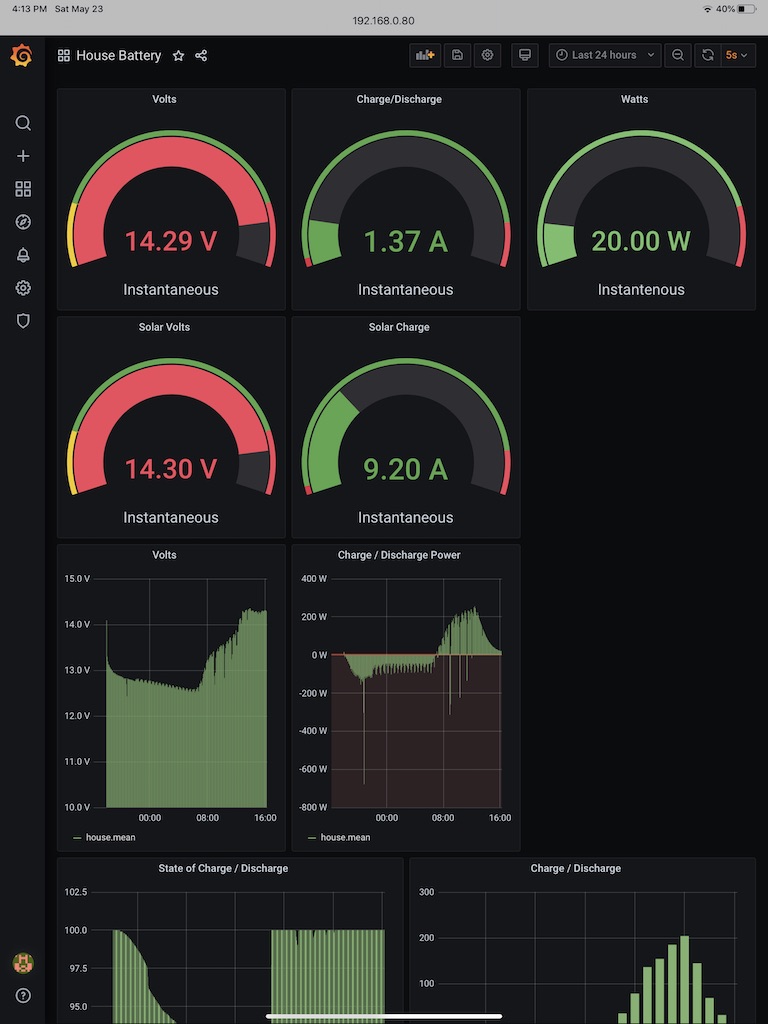
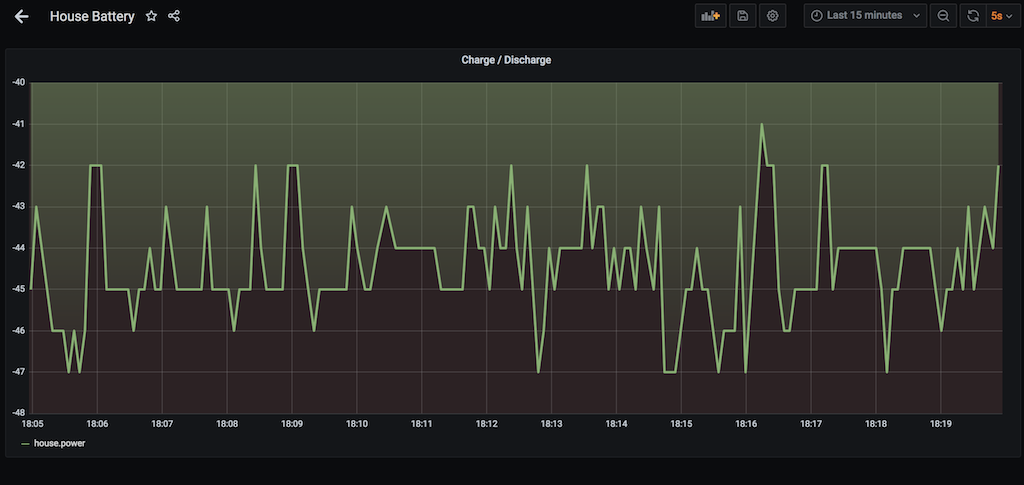
Energy generated from the solar panels goes to either the battery or to powering electrical items in Molly. So, the difference between the solar generation and amount used to charge the batteries is the house consumption. At last, we can now accurately measure house consumption. And better still, it is all recorded so we can go back in time and see how it changes over time.
Over a 8 hour period when the sun was down and we were sleeping, we consumed 40.0 Ahr, or an average 5.0 amps per hour. Well, that is quite close to the 4.7 amps predicted, with the difference probably being the fridges, as these were approximate figures. So now we know the steady state base consumption, with everything else being usage based.
Step 4 – New Batteries (October 2021)
We have since upgraded the batteries to lithiums. And have done some more measurements of consumption. And we have found a mystery power leak.
With the house electronics on and the fridge off, the consumption is 4.2 Amps at 13.2 volts, or 55 watts. This is higher than expected. The culprit was the inverter. The original estimate of 8 watts was incorrect, for two reasons. First, this the searching consumption, and we did not even have this turned on, so would have been more than 8 watts. Secondly, and more importantly, the inverter has a backload (no load) power consumption of 25 watts.
With the inverter off, the power discharged dropped to 2.3 Amps at 13.2 volts or a much more reasonable 30 watts. And better than our estimates.