There really is no need to monitor Molly’s engine for failure, as the FUSO Engine Management System and instrument panel is more than capable to alert the moment anything is even slightly wrong. Rather, we track of the diagnostics coming off the engine for fun and long term trends.
There were three phases to this project.
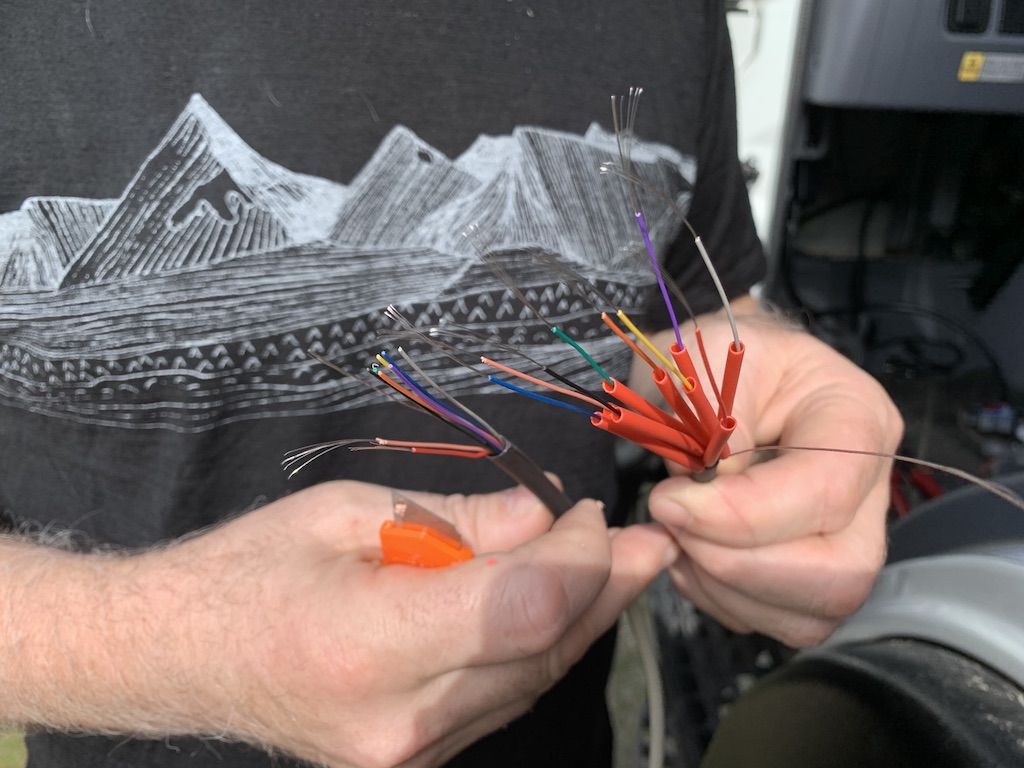
- Wire everything up, which was a little more involved than one might think.
- Then configure the computer to log the engine metrics and states.
- Finally write some software to use these metrics and generate useful information and alerts.
How is it all Wired Up?
The key component to make this work, is the connection kit from Cradlepoint. It connects the OBDII port of Molly to a USB port on the Cradlepoint. The software in the Cradlepoint can read the engine diagnostics and would normally send the information over the internet to fleet management software. In our case, we will use it merely to monitor how Molly is doing and log vital statistics for fun.
The connection kit is only the starting point, we needed to add a few more cables to the mix to make it work. Three cables connected in series were required form the necessary chain of protocol conversions.
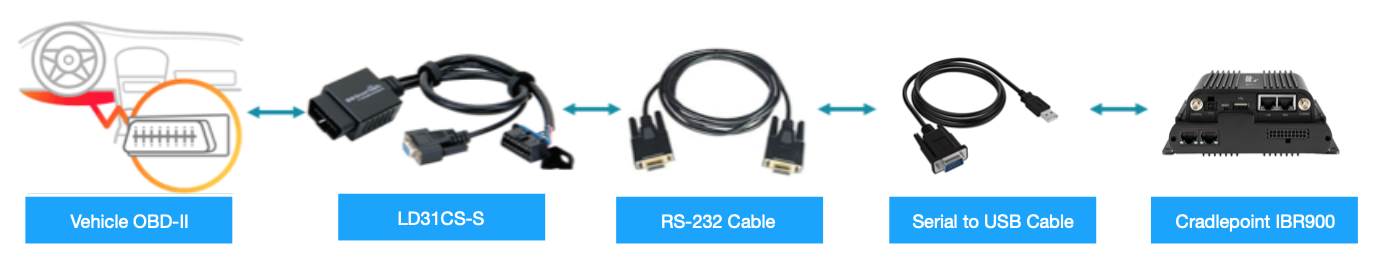
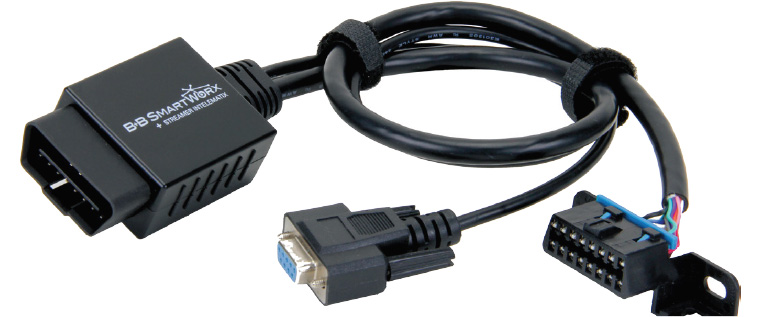
The OBDII port is converted into a more common, computer friendly format via the B+B Smartworx’s LD3IC-S data-interface adapter. This cable has a serial RS-232 output. However, the Cradleport modem doesn’t understand RS-232, so another cable is required to convert the RS-232 serial format into the USB serial format. This is easy enough, just need a FTDI based, Serial-to-USB converter cable. And between these two protocol conversion cables we have a null modem RS-232 extension cable, which spans the distance from the front of the truck, where the OBDII port is, to the electrical cabinet in the house where the Cradlepoint modem is located. Finally, and not shown on the picture above, the modem is connected to the computer via an ethernet cable. RS-232 might be a very old and slow communication protocol, but it is a good choice for this application, as it tolerates the electrically noisy environment very well.
The modem includes the software needed to receive the engine diagnostic information and transmit it to our computer.
Cradlepoint sells a serial-to-USB cable, which they call a COR Extensibility Cable. Unfortunately this solution did not work for us, as this cable plugs into the extensibility expansion port, and in our case, that port is already being used by the extensibility dock. So instead we used an FTDI serial-to-USB converter cable and plugged it into the only free USB port.
It turned out, configuring the Cradlepoint modem to receive the engine diagnostics was not completely straightforward. There are various settings that, if not set correctly, prevent it from working. Carefully following the Cradlepoint documentation is helpful to making this work.
Available Engine Diagnostics
Once the cabling was all connected and the basic data link or was connection established, there is now a long list of possible vehicle diagnostics information which can be transmitted. Unfortunately, not every value is supported, with only a subset of values being supported on the OBDII port. For our setup, it seems that FUSO implements the following values:
PID. Parameter
0 Vehicle Speed
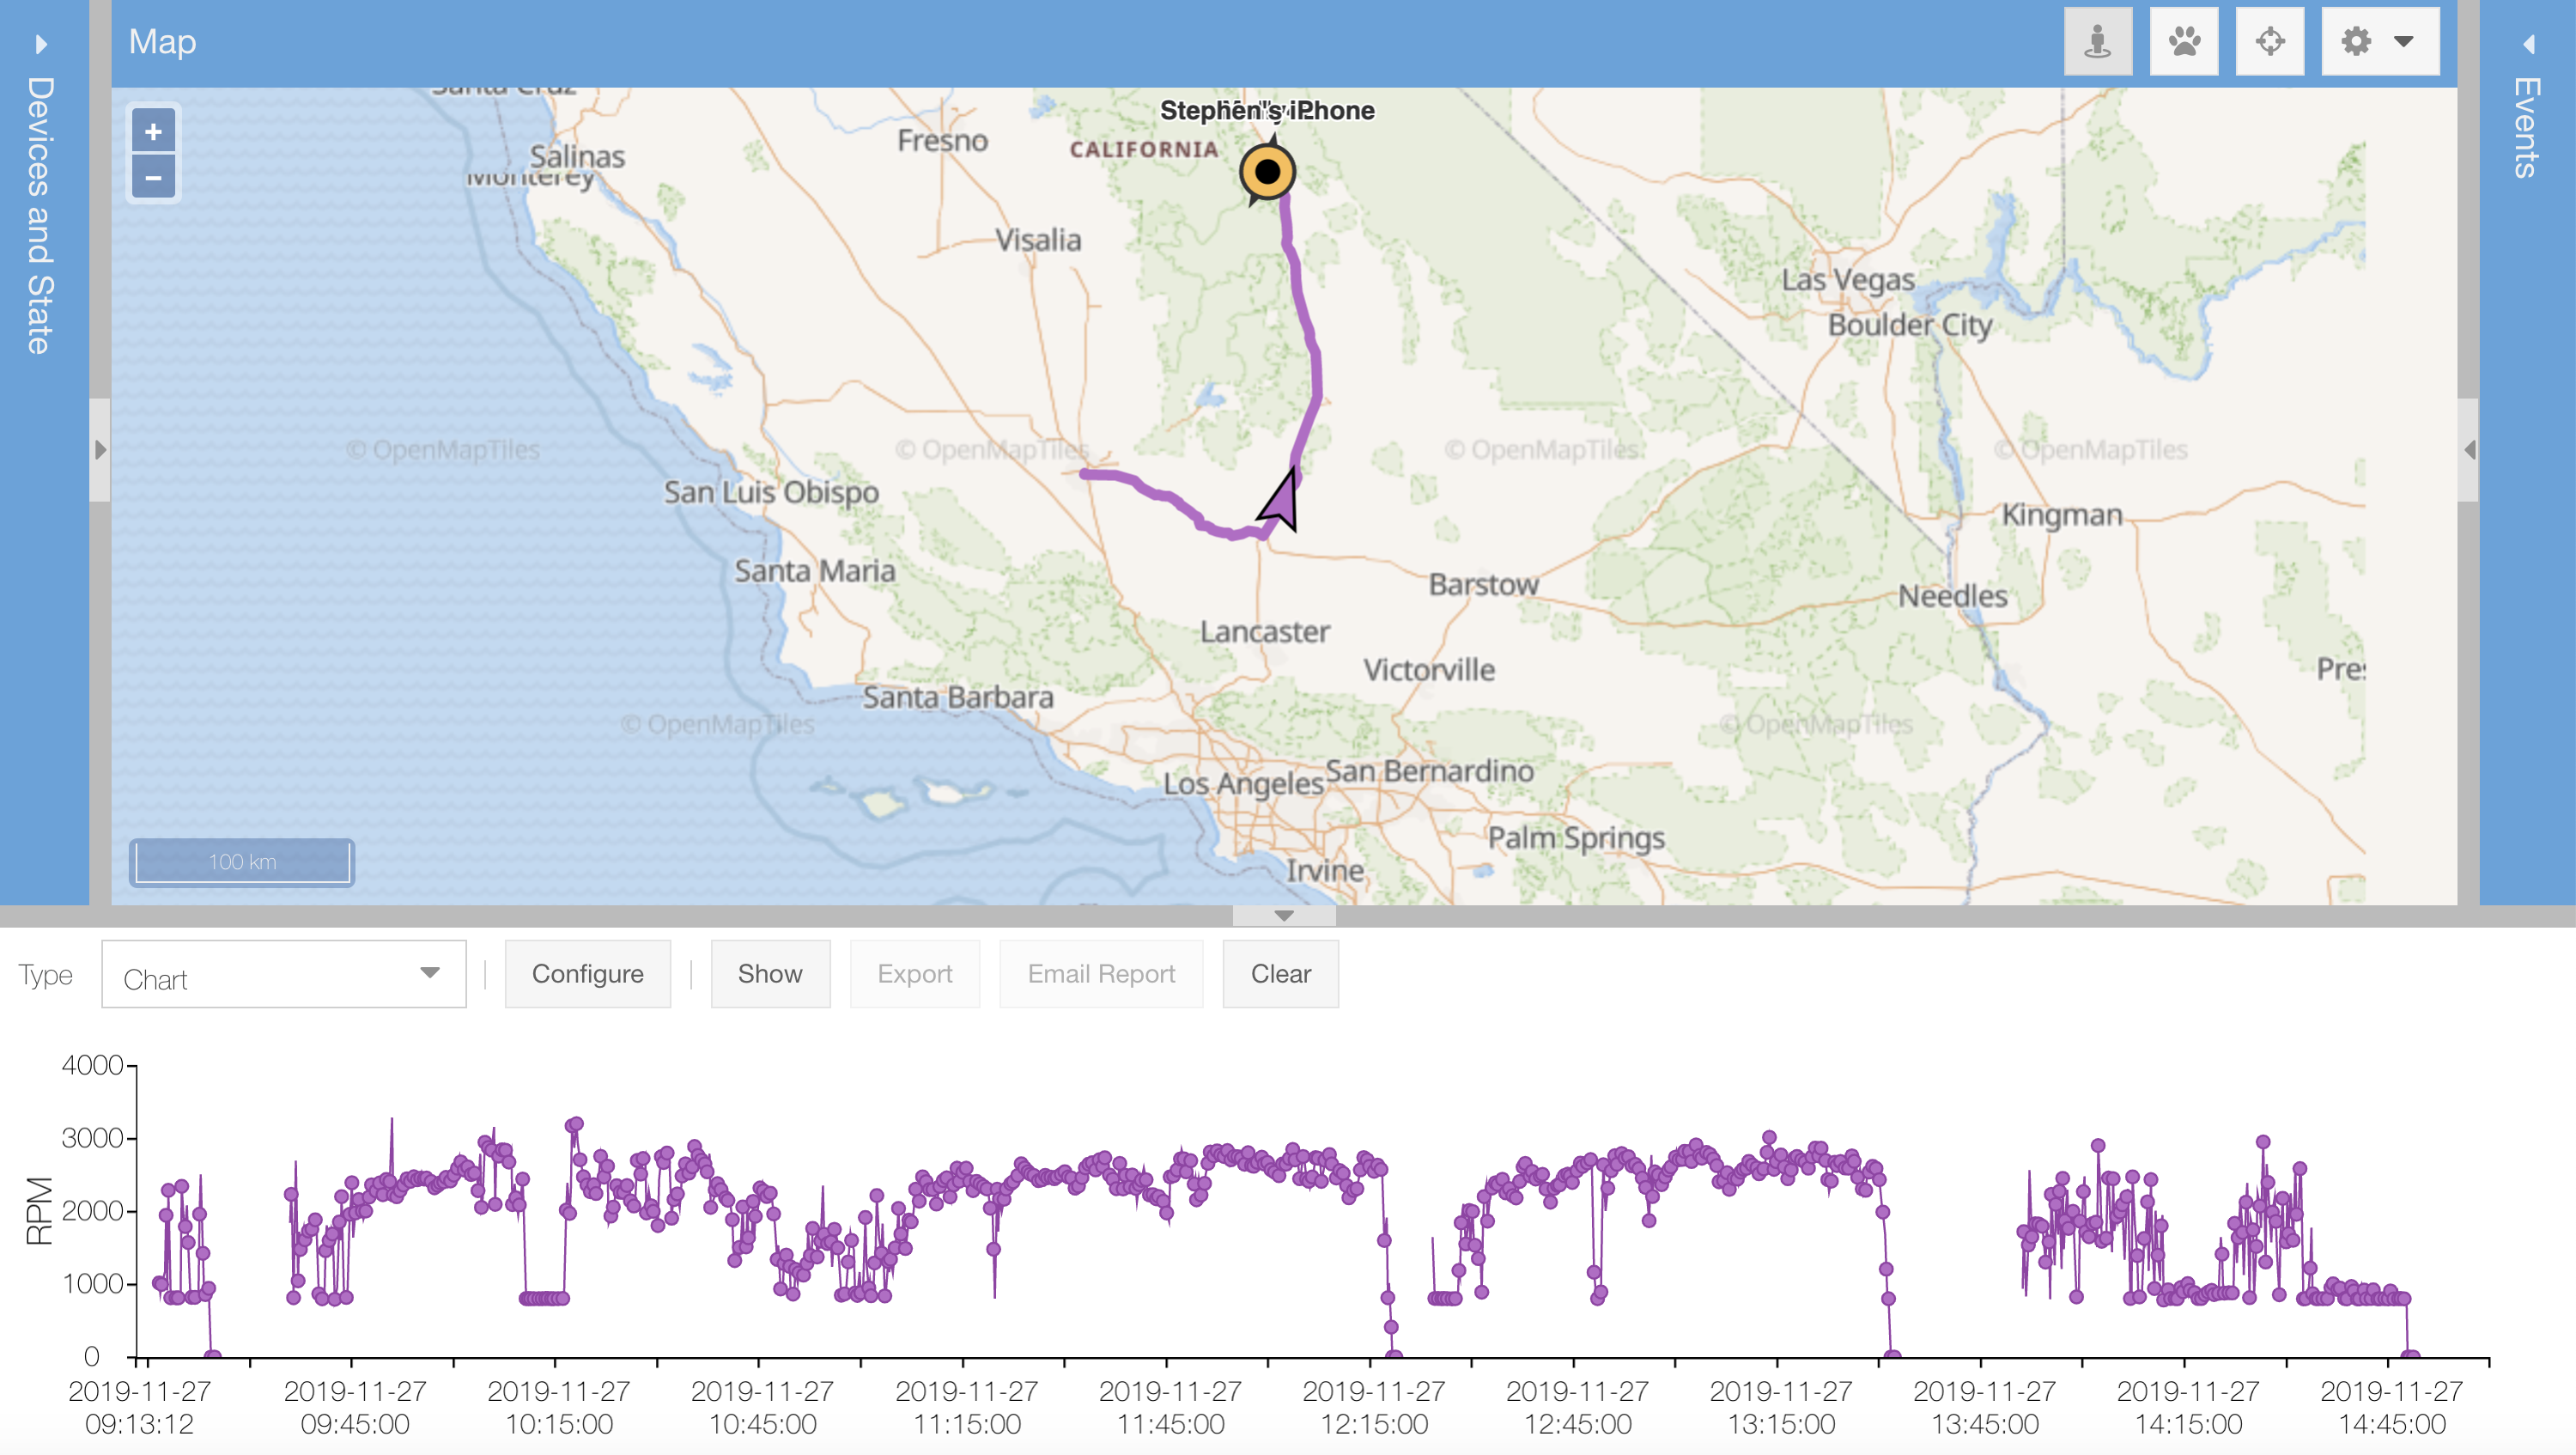
1 Engine Speed
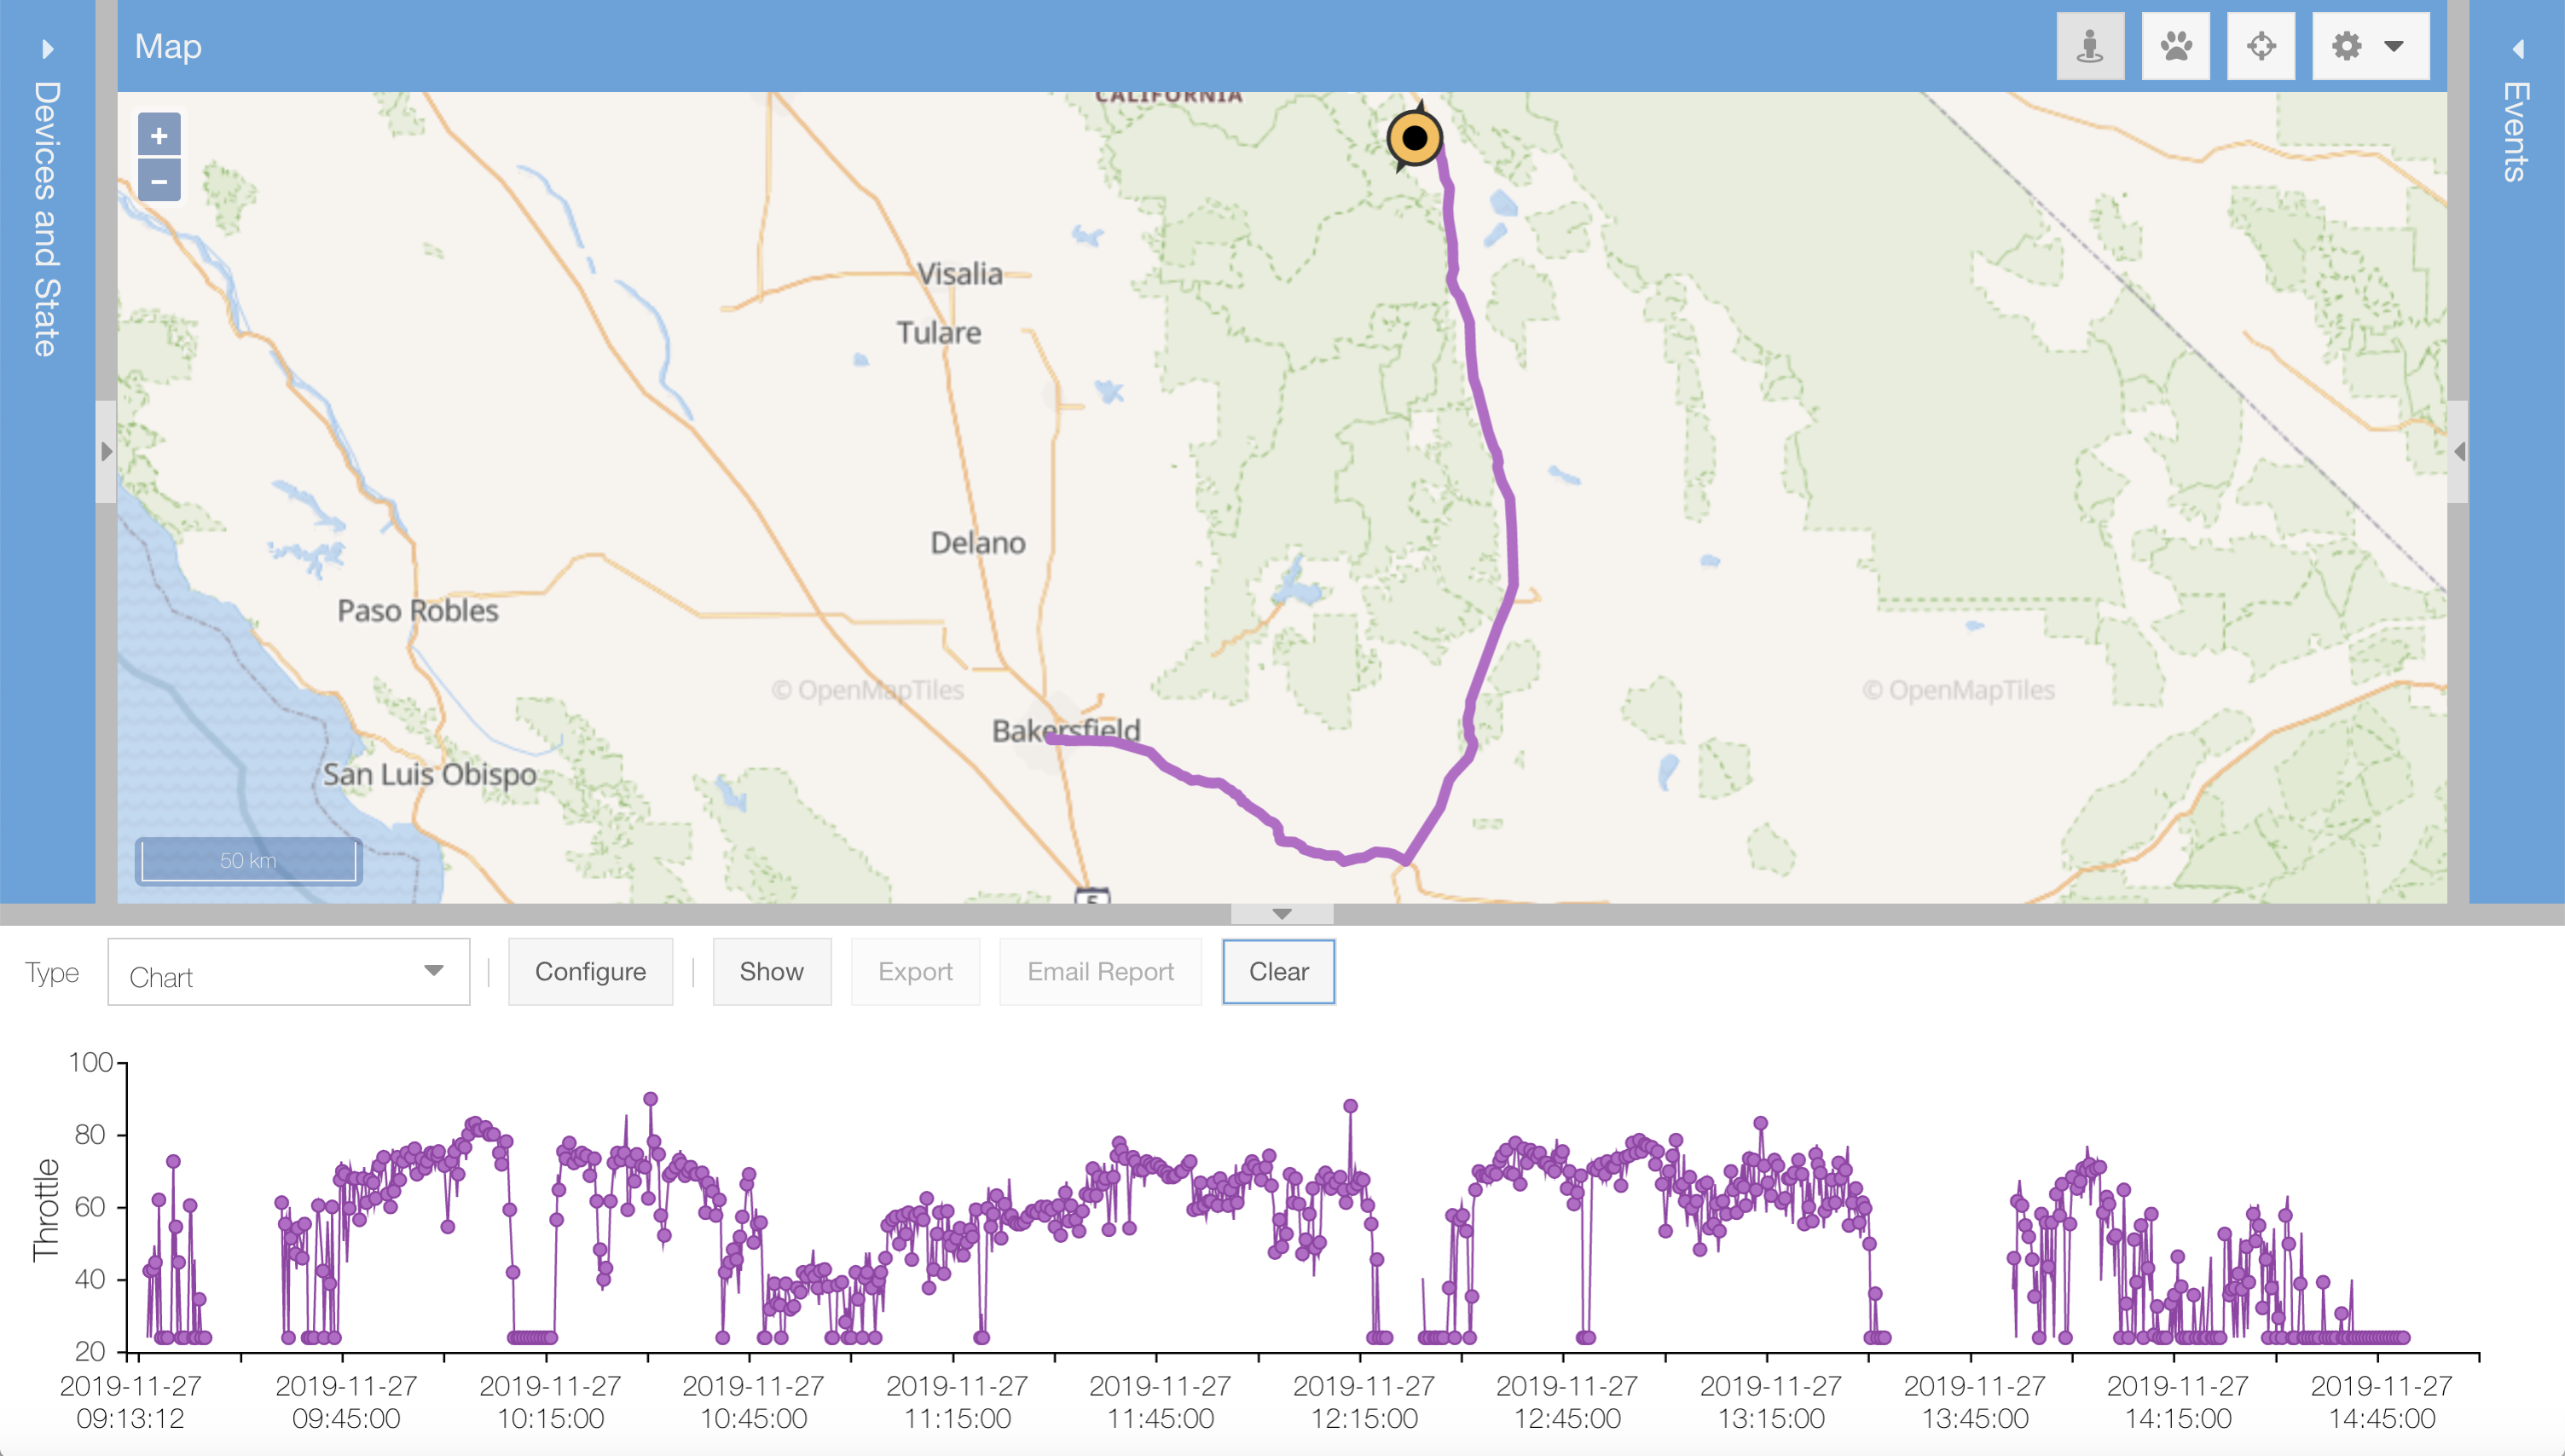
2 Throttle Position
7 Engine Coolant Temp
8 Ignition Status
9 MIL Status
12 Fuel Rate
13 Battery Voltage
14 PTO Status
16 Misfire Monitor
17 Fuel System Monitor
18 Comprehensive Component Monitor
19 Catalyst Monitor
20 Heated Catalyst Monitor
21 Evaporative System Monitor
22 Secondary Air System Monitor
23 A/C System Refrigerant Monitor
24 Oxygen Sensor Monitor
25 Oxygen Sensor Heater Monitor
26 EGR System Monitor
28 Ambient Air Temperature
34 Trip Odometer
35 Trip Fuel Consumption
36 Distance Since DTC Cleared
42 Barometric Pressure
44 Miles Per GallonCradlepoint has a reasonable guide on how to setup the engine diagnostics and how to enable or disable each the above parameters. We ultimately ended up enabling every supported parameter, because, you never know when you want to go back in time and see what a specific value was. The Cradlepoint documentation on these parameters is not completely correct. For example the Trip Fuel Consumption is not measured in Miles per Gallon, but rather Gallons per Hour.
There are multiple ways to send the engine diagnostics from the Cradlepoint to our computer, and we are using two of them:
- Configure the Cradlepoint modem to transmit engine diagnostics along with the GPS data, using a NEMA sentence like format. This was the easiest to setup, as we were already sending GPS data to our computer and just needed to click an extra box to add OBDII diagnotics.
- Use the IoT system to transmit engine diagnostics via MQTT.
Initially we only used method 1, as it was super simple to setup. But this did not work very well for us. Firstly, the Cradlepoint only sends information when the engine is running and for a few minutes after the engine has stopped. This means it is harder to detect if comms has failed, or the engine is just off. The main reason this does not work, is that the Cradlepoint software only sends GPS data when it had a good GPS signal. Of course, sometimes we lose the GPS signal. When this happens, the modem will not send the GPS coordinates, and it would also not send the engine diagnostics. We are not that interested int he GOS coordinates, as we get these another way. Bit we really do not want to lose the engine diagnostics. And to make matters worse, t seems the Cradlepoint software has quite a few bugs related to GPS, as it will lose GPS even when it has a good view of the sky.
So, we moved onto method 2 and the MQTT message broker. This method has been very reliable. The only problem with this method is the sampling rate, with the fastest rate being 1 sample every minute. Ideally we would like to sample every 5 to 10 seconds. Because of the lower than desired sampling rate, we use both method 1 and 2. we set the sampling rate for method 1 at 10 seconds and method 2 at 1 minute. This way are confident to get a reading at least every minute and typically get a reading every 10 seconds.
Just as a side note, because the Cradlepoint GPS software was so problematic, we ended up installing another GPS antenna to get location information. More about this in GPS Logging.
There are other ways to send the engine diagnostics, including remotely logging into the Cradlpoint modem using a script on the computer and using the CLI interface to query the status. But this is more complicated than we wanted.
Using the Engine Diagnostics
The information from Cradlepoint is present in two different forms based on the transport message. For method 1, is a an ASCII string of variables and values separated by commas, very much like NEMA 0183 sentences. This serial friendly format is sent over a TCP port. The following is an example sentence produced by the TCP In node in node-red configured to output a string.
$PCPTOBD,0,22.99,1,1600,2,46.30,7,174,8,ON,9,OFF,12,0.96,13,13.50,14,OFF,16,COMPLETE,17,COMPLETE,18,COMPLETE,19,COMPLETE,20,COMPLETE,21,COMPLETE,22,COMPLETE,23,COMPLETE,24,COMPLETE,25,COMPLETE,26,COMPLETE,28,73,34,13094.00,35,1049,36,,42,,44,*4FFor method 2, we use node-red and the the MQTT In node type. This node is configured to convert the messages into a parsed JSON object.
Add example of JSONThe MQTT based method has its own type of bugs. Notice the extra space at the end of some unit-less PIDs. Simple to clean up in code, but a bit sloppy on Cradlepoint’s part.
Once the engine diagnostics information is in node-red, there are some simple processing.
- Units are converted from US imperial to metric.
- Ignition Status is converted to a number to make it easy to calculate Engine Run Hours.
- Object types are converted from strings to integers or floats as appropriate.
- JSON is structured into an influxdb friendly format.
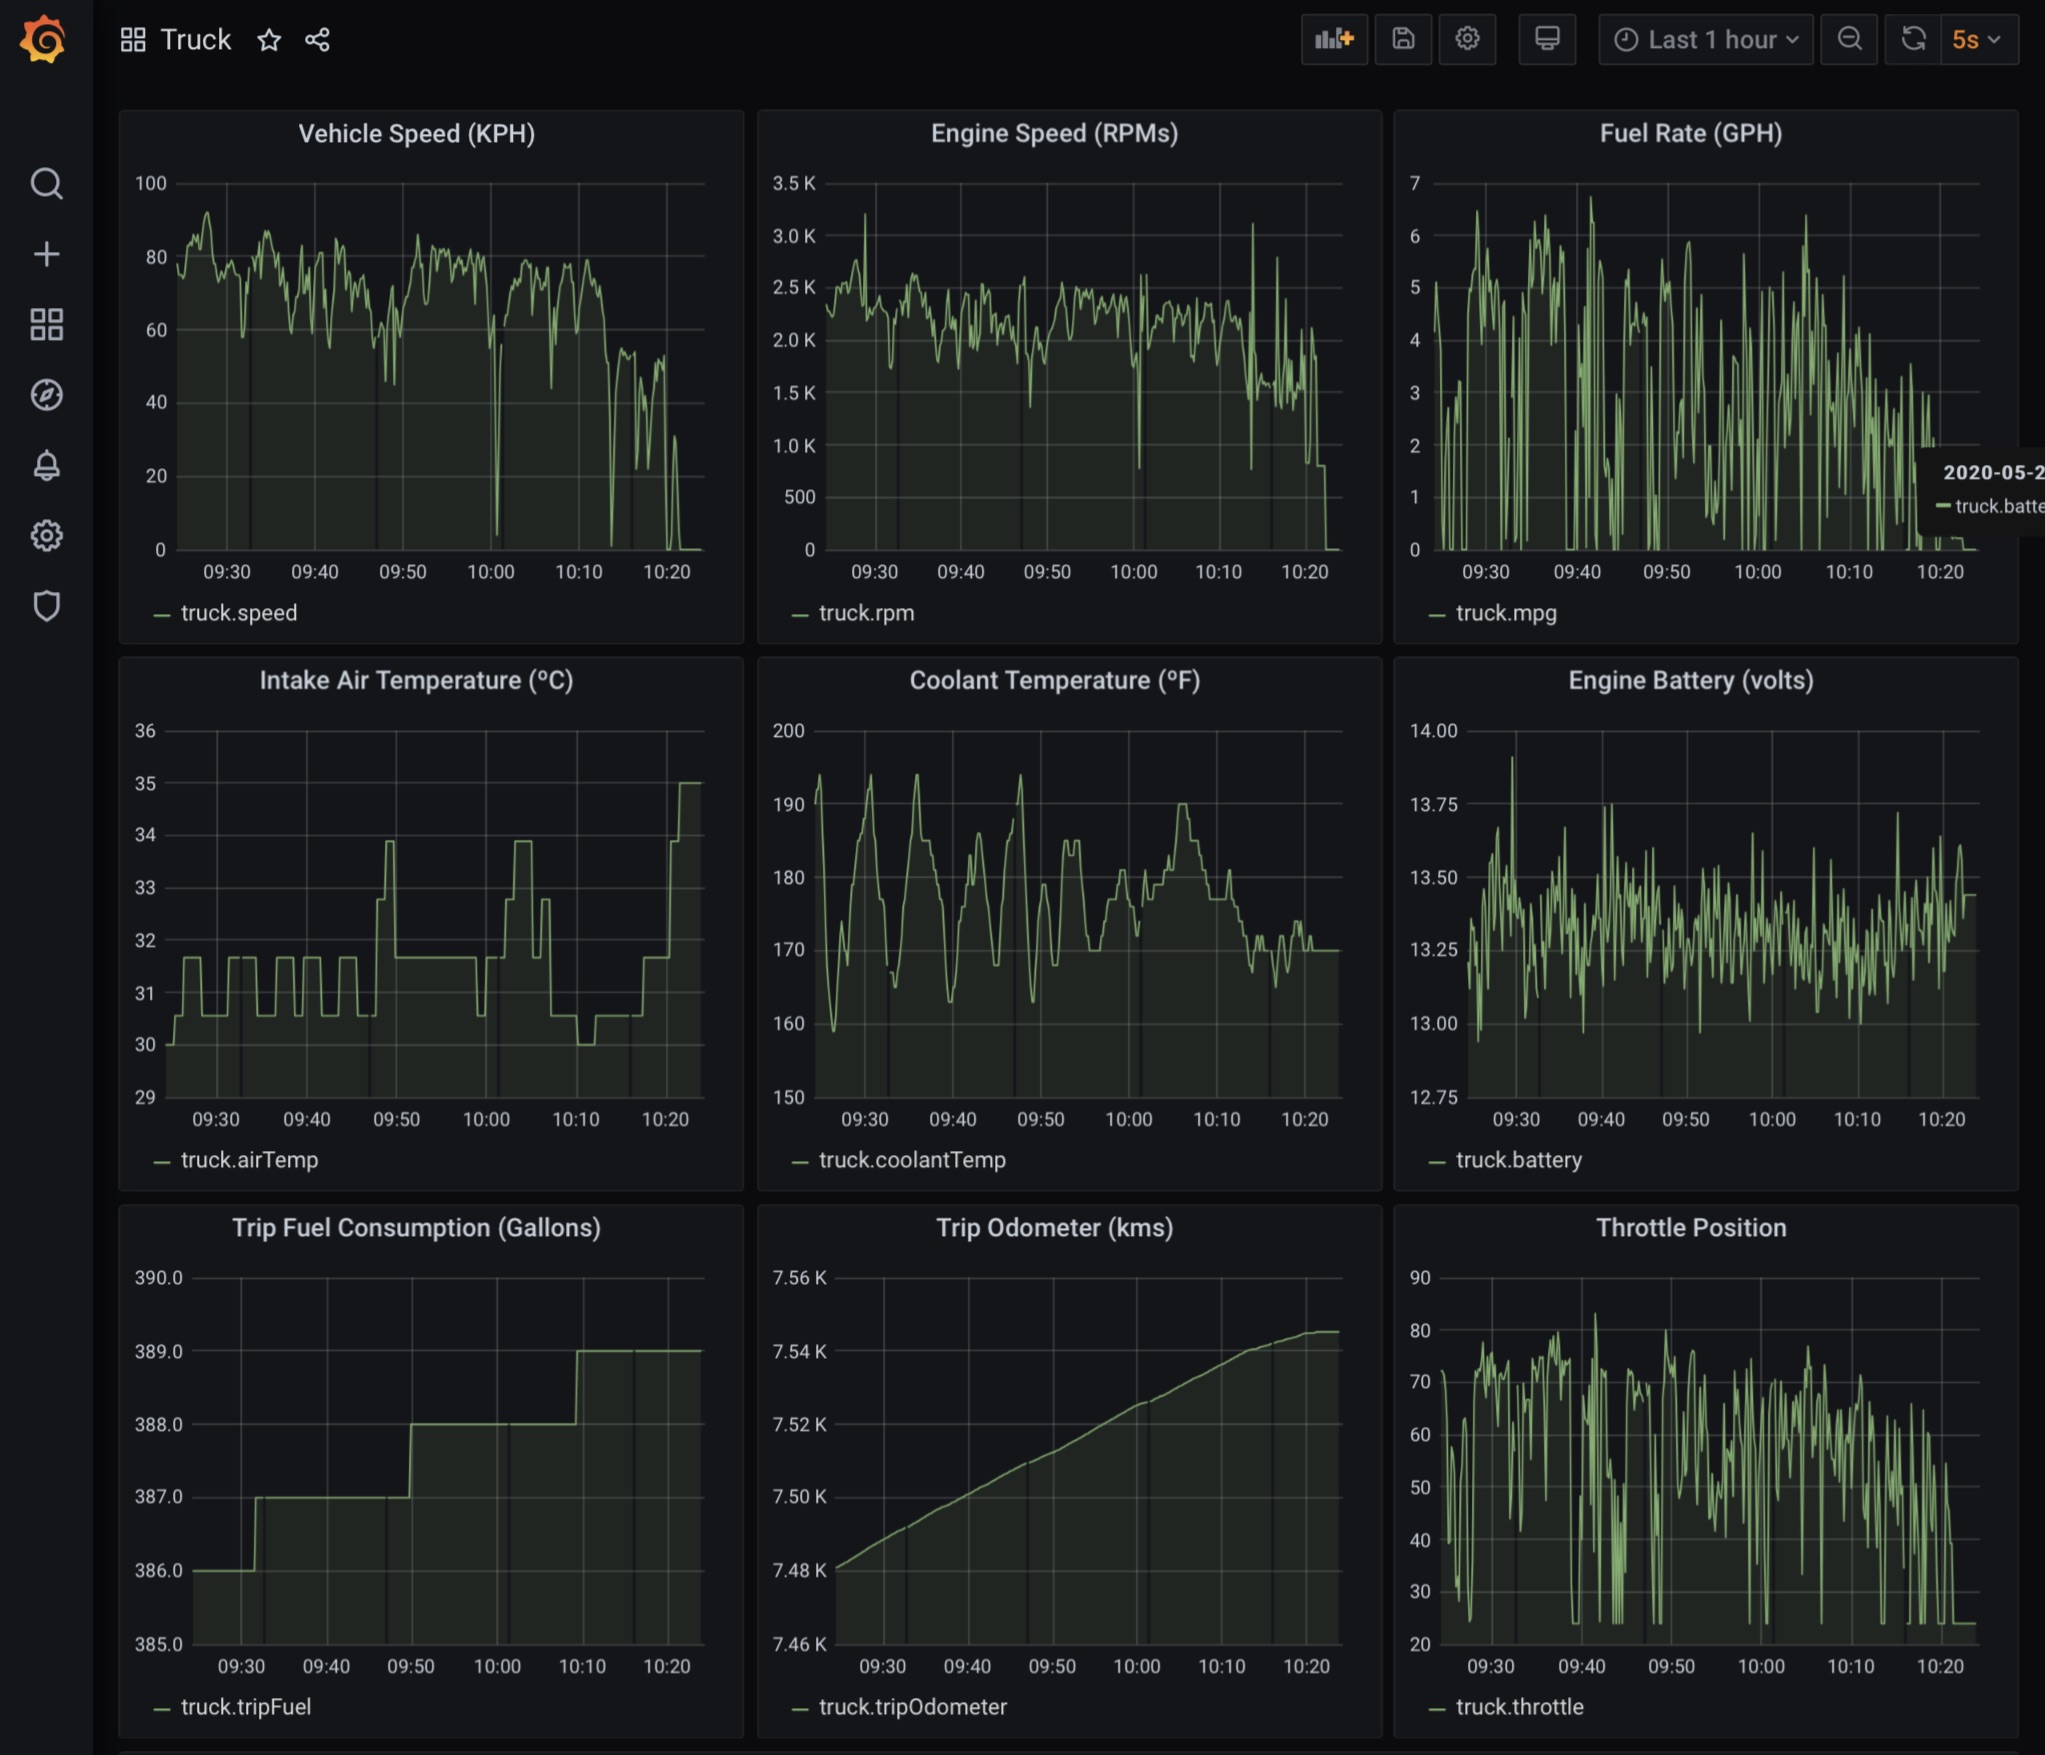
The new JSON object is sent to the influx database so it can be queries by Grafana. Influxdb is also stored to calculate the following derived values
- Engine Run time.
- Distance travel.
- Distance travelled since last fuel fill. For this one, we also record when the fuel is added to the fuel tank.
Traccar Sotware
The modem sends the OBDII vehicle diagnostics along with the GPS information in a NMEA sentence format. And since GPS sentences were already being sent to the Traccar software, it seems like an obvious place to also send the OBDII information. Although Traccar is built for fleet management and GPS tracking, it actually does not have great support for OBDII information. Fortunately Traccar it is open sourced software, so it is relative easy to extend the software. Just download the source, setup a development environment and code away. I took the previous work completed to ingest GPS NMEA sentences and extended it for the new OBDII sentences. There was one complication with the way the Traccar core pipeline processes line based sentence protocols. After discussing with the maintainers of Traccar, we never really sorted out the best way to implement the code for the Cradlepoint OBDII messages. The code written however works perfectly well.
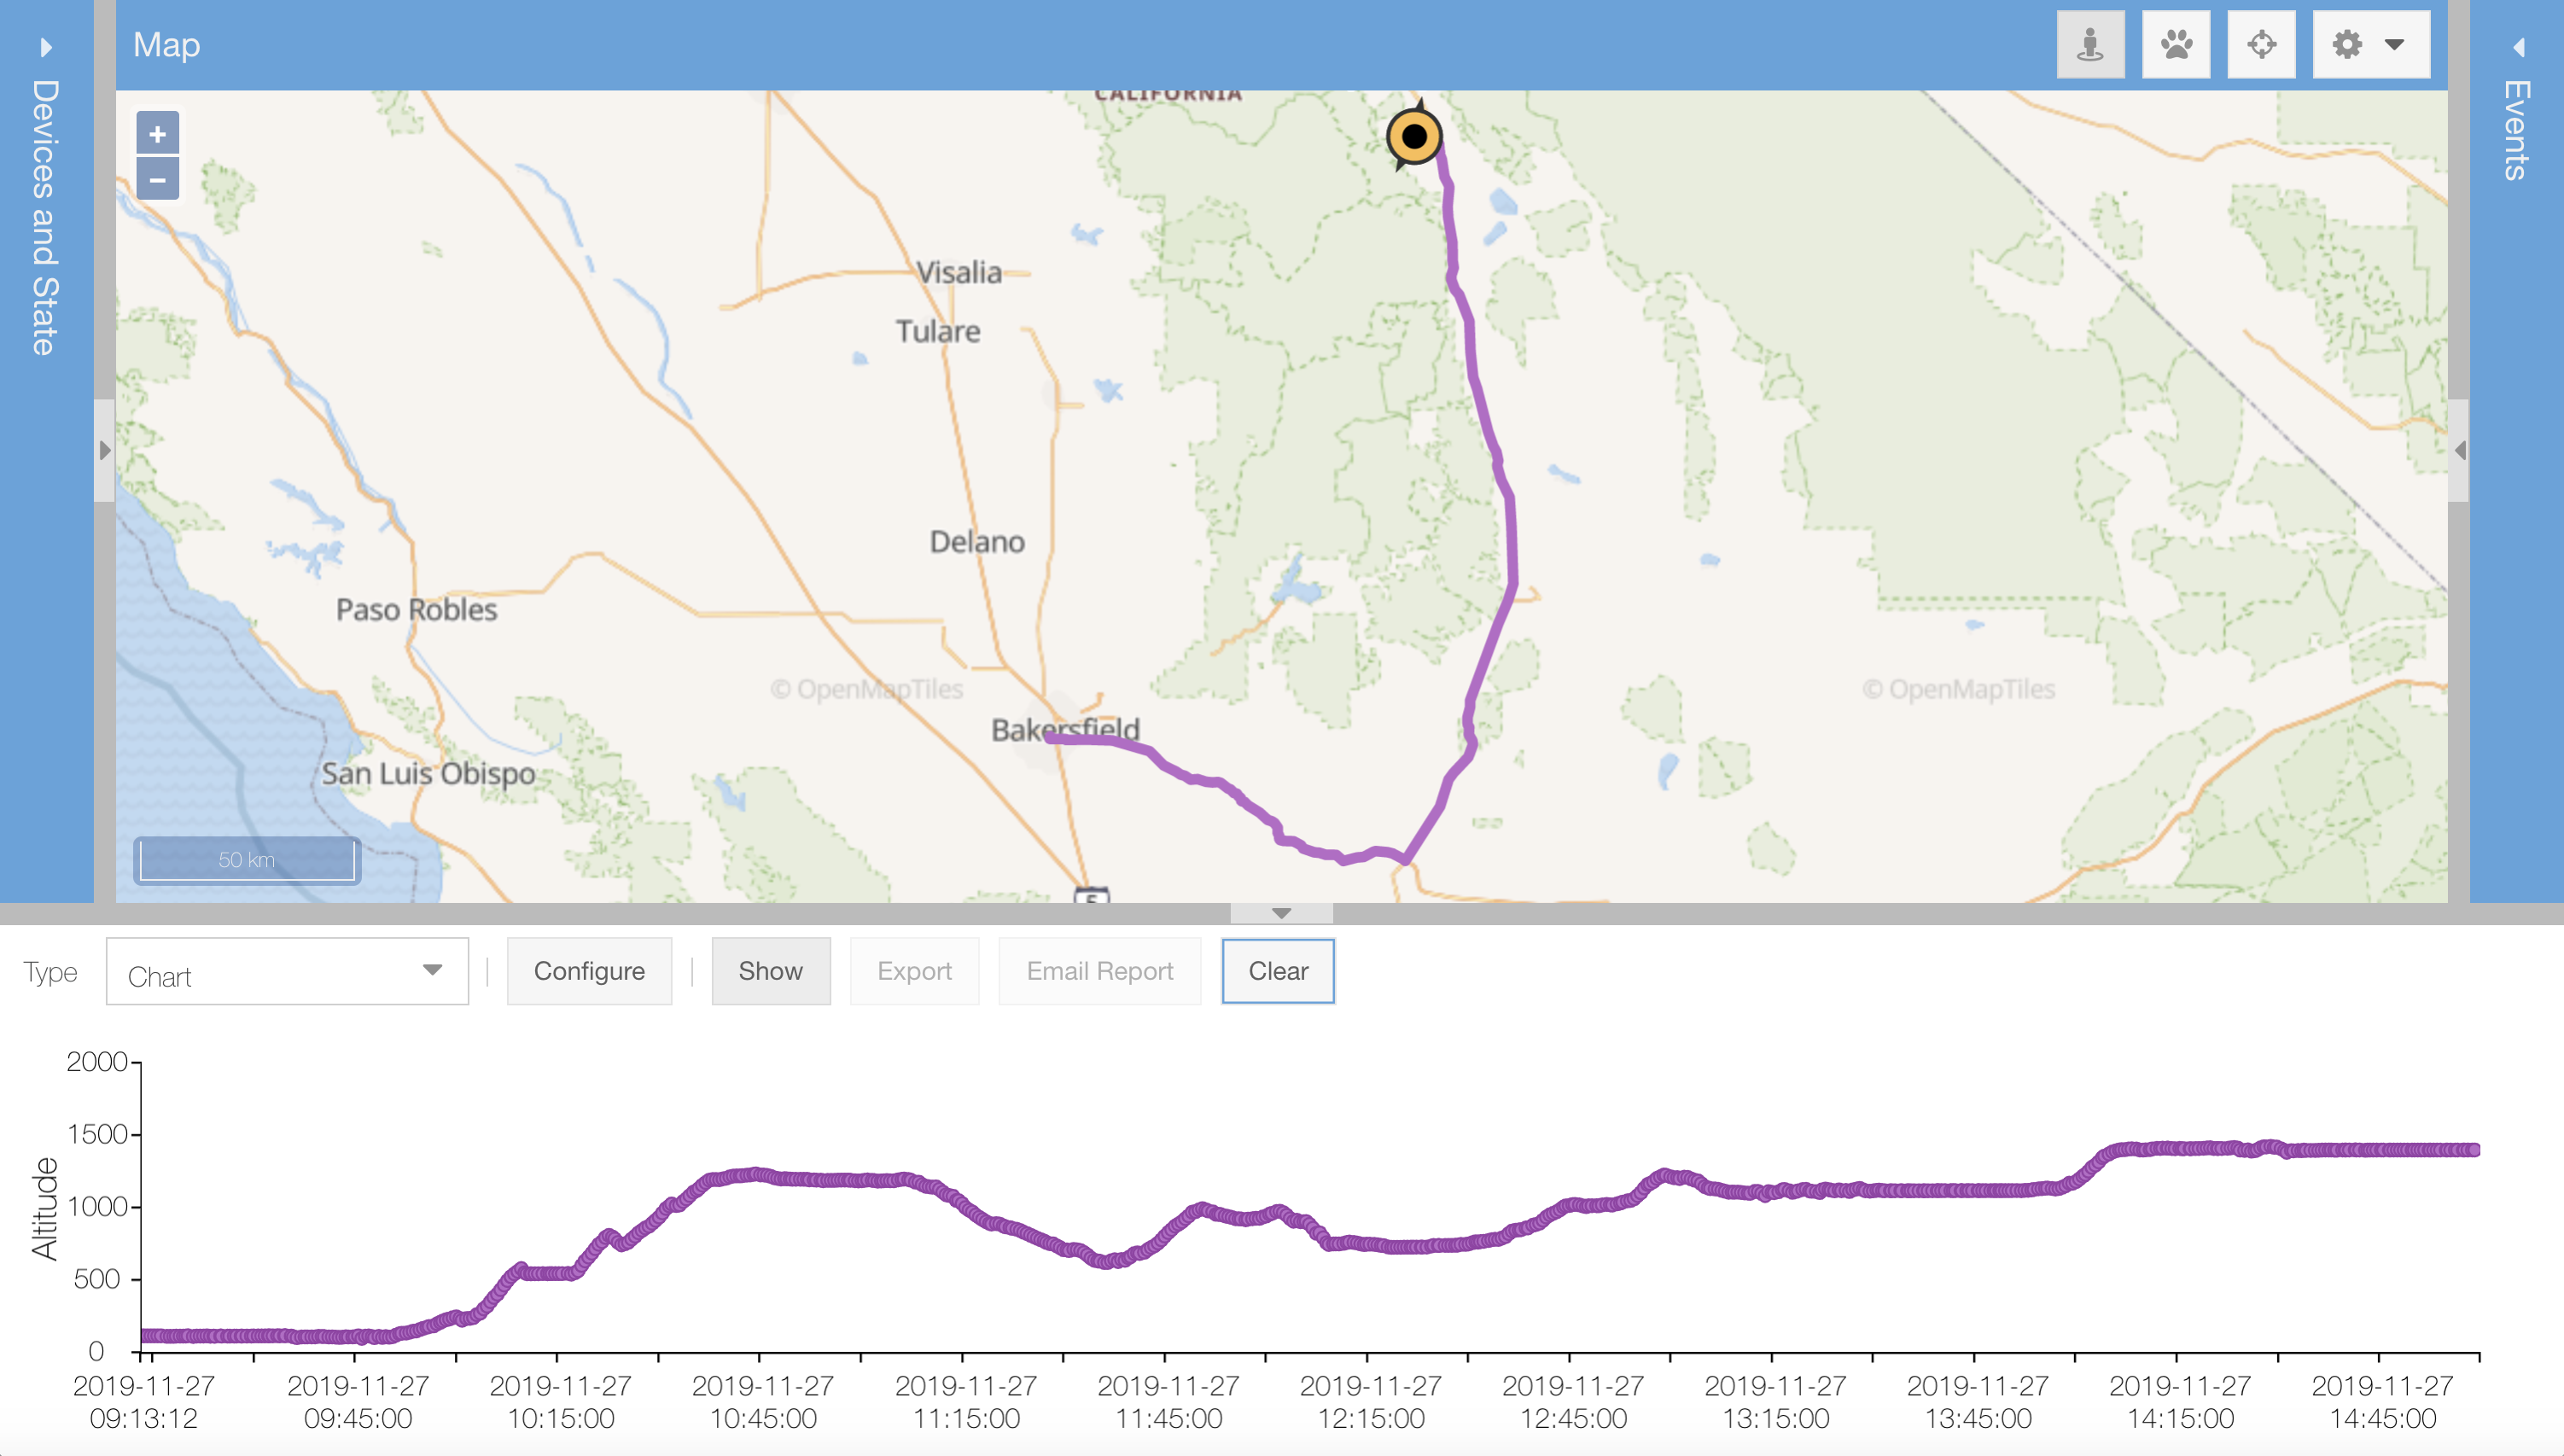
Traccar has a nice interface to see where vehicles are including tracks, but it is not that good at displaying OBDII information. There is a reporting function available for this, but it is hard to use.
An Alternative Approach – node-red and influxdb
The Cradlepoint modem allows multiple destination servers to be configured at the same time. So, in addition to sending the OBDII information to Traccar, it can also configured to send to the influxdb time series database via node-red. And once the information is in the database, then Grafana can be used to display the vehicle diagnostics, along with other. I think this new approach will be better.